Understanding Closing Costs

Alright… so it’s been a while since I’ve posted. I made a commercial. I hope you all were able to see it. I’m making a new one so I’m excited.

On to other stuff. Attached is a decent flow chart to helping understand closing costs. They aren’t cheap, and there is no way to get around them. I wish there were. I really do. But since we can’t avoid them the least we can do is understand them.

Each state has a different way of assigning closing costs to the two parties in a transaction. Sometimes it even varies according to county. In Florida, for example, the rules are the same for every county in the state EXCEPT for Miami-Dade and Broward.

I know… Florida.

ZWRlYTAwOWQtYTA1Yi00MzUyLWI2OTUtYzc5ZmU5NDQzZjVk_content_2015_07_Closing+Costs+Infogram.jpg

Please Stage Your Homes

Studies have shown, and I can speak from experience, staging your home will help it sell quickly.

April Market Update

Palm Beach:

People are buying slightly more SFR over condos (and financing those condo sales a bit more).  Supply increasing slightly and it’s taking slightly longer to sell, and a miniscule number are choosing financing over cash. 

Broward:

Apparently, all the cash SFR buyers are moving to Broward though it is taking much longer to sell, maybe because of more inventory so people are shopping more.

The same hold for condo sales, though more expensive, there are fewer sales, greater inventory, and more of those purchased are financed.

Miami-Dade:

More SFR sales, and those few more were financed, and they were slightly more expensive. 

So everything is really holding steady, with more buyers moving toward financing over cash.  You know what I’m going to say, right?  You know a guy… 

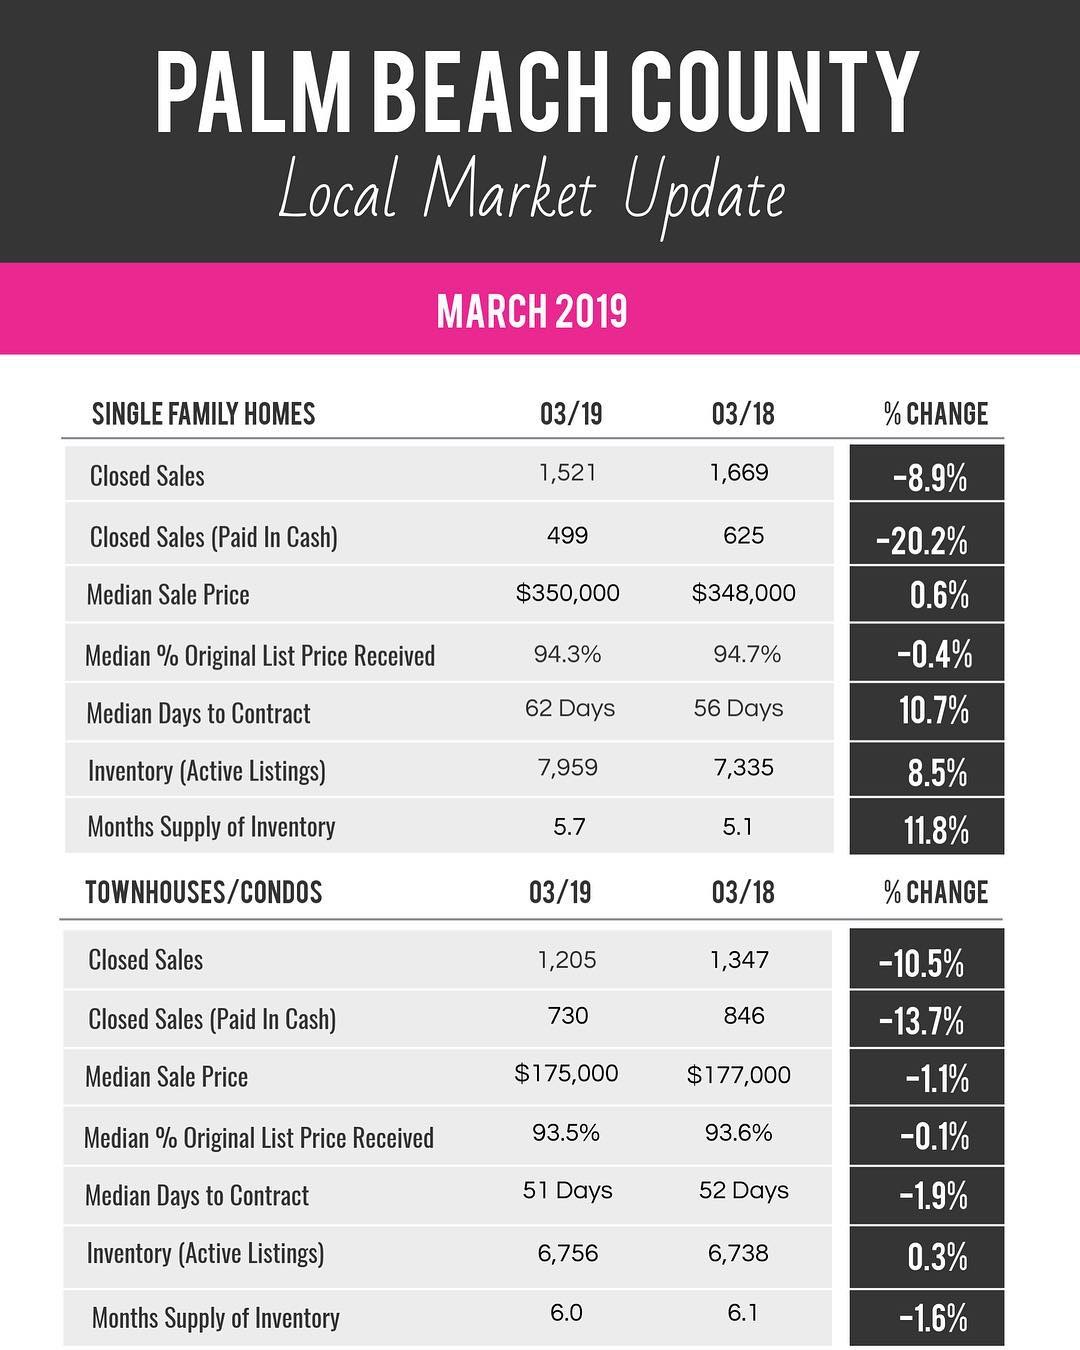
March South Florida Market Update

Okay... so March is in. Everywhere is looking not as good as it was a year ago with the possible exception of Miami-Dade in the condo-space, and the trend does seem to show more financed sales gaining over cash (luckily you all know a great outlet for that).
And there isn’t a drop in price or really in time to sale.

So sales are taking longer, slightly, and there are fewer of them, slightly... but you’re getting more for the sale, slightly.

Meh? Still pretty good.

Inacurate Mortgage Ads: Exhibit A.

Social media bombards us with ads.  (Spoiler Alert: That’s the entire reason socials exist… they are ad machines).  But how accurate are those ads? 

Here is a small example:  I saw this the other day and I’ve redacted all non-clip art and identifying information. 

“FHA home loans are so popular”. 

That’s True.  And yes, there is a low-down payment feature.  And here is where the problems start. 

“As long as your credit score is a minimum of 580”. 

Well, yes and no.  While the Federal Housing Authority does set their minimum credit score at 580, all lending institutions have additional criteria they all add on to the government-mandated minimum.  There might be a very few lenders that will accept a 580 credit score, but with a lower credit score there are always higher down-payment requirements.   

“…you are eligible for a 3.5% down payment…”. 

No.  Not with a 580 credit score.  Yes, the FHA minimum is 3.5%, but that is with a 620 credit score.   

“…with the possibility of reduced closing costs”.

Um… no.  Closing costs are closing costs.  Unless this is an outright fallacy, the only way this statement makes sense is if the people who wrote this ad mean the inclusion of the Mortgage Insurance Premium into the loan amount.  A buyer is still paying all costs… just over 30 years.  With interest. 


But FHA loans ARE popular.  So the ad was accurate in that.  Everything else, not so much. 

fha error ad.jpg

So... February Numbers Are Out.

So.... Broward and Miami-Dade are getting slightly more expensive. That's really the only questionably good news I can pull out of this. Although, maybe this was reflective of the uptick in rates that President Trump stopped at he end of the reporting periods in question, and before the tax exodus from the NorthEast began? To me this just reads as “getting more expensive for new arrivals” but that also means getting more expensive for those staying. I dunno… the more I think about this stuff the more I can see other variables in play. Credit is slightly more expensive and the decreases are marginal so maybe that is part of it? This mentioned nothing about the consumer price index. Macro-economic pressures are not mentioned either. This may lead to my oft-thought contention that SouthFlorida is just saturated an the model is shifting more toward a New York metro-model. Vertical construction with outlying, largely stagnating borougs, and the more I think about this that makes perfect sense. Hopefully that isn’t the case but maybe that opens the door to other opportunities in our state.

IMG_4192.JPG
IMG_4191.JPG

It Sounds Hokey, but....

First, apologies. The last several blog posts didn’t post… and I don’t know why. We’ll have to figure that out with our IT team.

Anyway, I saw this the other day. Kind of psyco-babble maybe, but I started trying to live by these tenants a couple of year ago and I have to admit, my life turned around considerably. I invite anyone struggling to do the same.

IMG_0726.JPG

The Fed Meets... (with translations)

Press Release


 PDF

January 30, 2019

Federal Reserve issues FOMC statement

For immediate release

Now

Information received since the Federal Open Market Committee met in December indicates that the labor market has continued to strengthen and that economic activity has been rising at a solid rate. Job gains have been strong, on average, in recent months, and the unemployment rate has remained low. Household spending has continued to grow strongly, while growth of business fixed investment has moderated from its rapid pace earlier last year. On a 12-month basis, both overall inflation and inflation for items other than food and energy remain near 2 percent. Although market-based measures of inflation compensation have moved lower in recent months, survey-based measures of longer-term inflation expectations are little changed.

As always, this is the “report card” paragraph where the Fed grades the US Economy.  Employment gets a solid A-.  Jobs are plentiful and unemployment is low.  Household spending (spending by people like you and me) is growing nicely and also gets an A-.  The Amazon boxes continue to pile up on our porches.  Business spending gets a B.  Businesses are spending – but not as much as a year ago.  And inflation gets a B+.  Prices are rising somewhat but well within the range that makes the Fed happy.  Another refrigerator magnet-worthy report!

Consistent with its statutory mandate, the Committee seeks to foster maximum employment and price stability. In support of these goals, the Committee decided to maintain the target range for the federal funds rate at 2-1/4 to 2-1/2 percent. The Committee continues to view sustained expansion of economic activity, strong labor market conditions, and inflation near the Committee's symmetric 2 percent objective as the most likely outcomes. In light of global economic and financial developments and muted inflation pressures, the Committee will be patient as it determines what future adjustments to the target range for the federal funds rate may be appropriate to support these outcomes.

The Fed combined what used to take two paragraphs into one – efficiency!  This is the “money paragraph” where the Fed lets the world know they are keeping short term rates the same as they were before.  And they also tell us how they do their job.  They want to keep rates low enough to keep people working but high enough so prices don’t rise too fast.  The last two sentences use a lot of fancy-sounding language to basically say, “We’re going to do a bunch of nothin’ this time around…”

This made the markets (both stock and bond) happy.  Longer term interest rates dropped and stock prices went up.  Win/win.

In determining the timing and size of future adjustments to the target range for the federal funds rate, the Committee will assess realized and expected economic conditions relative to its maximum employment objective and its symmetric 2 percent inflation objective. This assessment will take into account a wide range of information, including measures of labor market conditions, indicators of inflation pressures and inflation expectations, and readings on financial and international developments.

This is the same paragraph they always throw in where they basically say will review a lot of information (visualize hundreds of people with bad haircuts and mismatched socks) to make their future decisions.  Not sure why they feel they need to tell us this.  Maybe they think we believe they use their horoscope or a Ouija board to make trillion dollar monetary decisions…

Voting for the FOMC monetary policy action were: Jerome H. Powell, Chairman; John C. Williams, Vice Chairman; Michelle W. Bowman; Lael Brainard; James Bullard; Richard H. Clarida; Charles L. Evans; Esther L. George; Randal K. Quarles; and Eric S. Rosengren.

All the nerds agreed!